Systemic Risks of Exchange-Traded Funds

etf_largeIntroduction

If we look back at history (2008 in particular), the market collapse that occurred is attributed by many observers to have been the result of a liquidity crises. With the fall of Lehman Brothers, the crunch was upon us as billions of dollars of underlying instruments began to be liquidated (credit default swaps in particular engineered by AIG Financial Products and others). Financial engineering (basically high-end computer modelling would make us all millionaires) was at its peak until it fell off the cliff. And when you look at history, it was just another get rich quick scheme that failed.

Systemic Risks of Exchange Traded Funds

Well, here we go again. It seems that within the wonderful world of exchange traded funds (ETFs) the brave, soldiering on financial engineers have yet again found a home. Without very much fanfare and notoriety the people who brought you Lehman Brothers and AIG Financial Products are back in action with the new darling of potential financial collapse. In a paper written for the Bank for International Settlements entitled: BIS Working Papers No 343 Market structures and systemic risks of exchange-traded funds the author looks at the risks now embedded in ETFs. Similarly the Financial Times of London reported in an article entitled Record growth for exchange traded funds despite regulatory fears that there are growing concerns about the potential adverse consequences of ETF structures on markets.

The problem is that many ETFs now include complex structures used to replicate the movement of certain indices by using derivatives rather than the underlying instrument. As we learned , the use of derivatives allows for the introduction of financial leverage given that swap counterparties do not require the positions with them are secured by other assets or supported 100 per cent by equity (cash). These structures are in many respects similar to those that brought the house down in 2008. The financial system is at risk in pretty much the same way that it was them. You get a “domino effect” if one of the players stumbles or tumbles.

Definition of ‘Leveraged ETF’
An exchange-traded fund (ETF) that uses financial derivatives and debt to amplify the returns of an underlying index. Leveraged ETFs are available for most indexes, such as the Nasdaq-100 and the Dow Jones Industrial Average. These funds aim to keep a constant amount of leverage during the investment time frame, such as a 2:1 or 3:1 ratio.

Here is an example of a leveraged ETF – Direxion Daily Small Cap Bull and Bear 3x Shares.

Here is a brief overview of the ETF provided by the manager’s:

Overview

The Direxion Daily Small Cap Bull and Bear 3x Shares seek the daily investment results, before fees and expenses, of 300% or 300% of the inverse (or opposite) of the performance of the Russell 2000® Index. There is no guarantee the funds will meet their stated investment objectives.

These leveraged ETFs seek a return that is +300% or -300% of the return of their benchmark index for a single day. The funds should not be expected to provide three times or negative three times the return of the benchmark’s cumulative return for periods greater than a day.

If you have a look at the financial statements of the ETF you’ll notice that the leverage in the fund is provided through equity swaps. There is no debt on the balance sheet that I can see. There is a very lengthy note to the financial statements describing the swap arrangements that are entered into and calculating the mark to market gain or loss on the outstanding contracts.

It would seem to me that there are a great number of these equity derivative contracts out there. The question is what types of events which cause these contracts to unwind. Presumably the exposures created are not that dissimilar from the credit derivatives disaster that plagued us in 2008.

These swaps are entered into with the usual suspects-Bank or America, Citibank, Deutsche Bank and Banque Paribas. These are counterparties that have been involved in swap markets from the early days in the 1980s. They continue to take on these risks because the contracts are capital friendly and hence generate significant returns on the bank’s capital.

Another question that pops up in my mind is where are the regulators in all this? This is another prime example of banks entering into transactions that would have significant material adverse implications for financial markets if there was a major disruption of some sort-some kind of liquidity event that triggers something larger. Here the banks, again, are being allowed to get into something that may endanger the financial system. In 2008 the market activity was outside the parameters of the stress testing of assets that occurred at the major financial institutions and that regulators relied upon so heavily. When something happens that causes a major market disruption involving ETFs it will probably be outside the “worst case scenario.” It always is. If the regulatory “stress testing” included an outlying event, they would have put the “clamps” on by now. The reality is that the train has already left the station. It would be difficult to unwind what is already out there without major market disruption. So the regulators, in my opinion, remain silent.

research

Conclusion

I am reminded in some ways of the Great Crash of 1929. During the time preceding the crash, the financial engineers of that time created the investment trusts. The investment trusts used leverage to enhance the returns on their portfolios at a time when it seemed that the stock market would go up forever. Well the leverage worked in their favor when markets were going up and accelerated the market decline when the market was going down.

We’ve been here before and will get their again. You can bet on it. 2008 is just a faint memory in the under thirty crowd cranking those algorithms through their computers. The B school graduates and the PhDs in mathematics are at it again (or rather still). The old timers are gone, the regulators co-opted by the fact that the balances are so large, there is no going back. The clock is ticking.

In the end, I believe that if I invest in sound business, they will withstand the test of time and market corrections.


???????????


Here is a brief video discussing what systemic risk is.

Some Additional Information

I have just completed reading a paper delivered by the Securities & Exchange Commission Commissioner Michael S. Piwowar entitled: Remarks at the 2015 Mutual Funds and Investment Management Conference. In that presentation Commissioner Piwowar attacks a number of regulatory bodies regarding their views on the possible impact that leveraged ETFs may have on financial markets:

Another example of jumping to a conclusion without engaging in a deliberate analysis of available data is with respect to leveraged inverse ETFs. Leveraged ETFs typically are designed to achieve their stated performance objectives on a daily basis. To accomplish their objectives, leveraged ETFs pursue a range of investment strategies through the use of swaps, futures contracts, and other derivative instruments. Over the past several years, regulators, sponsors, and brokers have engaged in efforts to convey to investors the understanding that performance of leveraged ETFs over longer periods of time can significantly differ from the underlying index or benchmark.

But, there is a false narrative about leveraged ETFs being spread by the prudential regulators. It is the unsubstantiated assertion that these products contribute to increased volatility in the financial markets because they must rebalance their portfolios in the same direction as the contemporaneous return on the underlying assets in order to maintain a constant leverage ratio. In other words, these types of ETFs purchase assets when they go up and sell assets when they go down. According to the prudential regulators, the added volatility can therefore be destabilizing to the markets, especially during periods of adverse stress.

A recent working paper, however, by researchers at the Federal Reserve and the Pennsylvania State University looked at actual data and the operations of leveraged ETFs.[29] Their paper examined the effects of capital flows on leveraged ETFs and found that earlier criticisms about the contribution of such ETFs to market volatility are likely exaggerated. The paper observed, empirically, that capital flows substantially reduce the need for leveraged ETFs to rebalance when returns are large in magnitude. The capital flows thereby mitigate the potential for leveraged ETFs to amplify volatility. In other words, one of the Fed’s own economists concludes that concerns about leveraged ETFs are overblown.

Notwithstanding the prudential regulators’ baseless criticisms (these are pretty strong terms being used by one regulator talking about another), there are three areas of our regulatory regime that might warrant a closer look: fund data reporting, in-kind redemptions, and temporary suspension of redemptions.

The Commissioner is referring to a paper that I have linked above entitled: Are Concerns About Leveraged ETFs Overblown?. If you can read this paper than you are way up the curve from me.

Here is their conclusion:

Concluding Remarks

Leveraged and inverse ETFs have received heavy criticism based on the belief that they exacerbate volatility in financial markets. We show that concerns about these types of products are likely exaggerated. Empirically, we find that capital flows considerably reduce ETF rebalancing demand and, therefore, mitigate the potential for ETFs to amplify volatility. Our analysis has relevant and timely policy implications, as regulators are reportedly considering changes to how ETFs are regulated. 

With all due respect to Commissioner Piwowar, he is an academic and has no market experience. Arming himself with academic studies as the basis on which to protect the stability of the global financial system is reminiscent of what happened during the crisis of 2008. Suffice it to say that this kind of blind optimism expressed by the Commissioner is the type of optimism that got us into the 2008 financial crisis.

Perhaps Commissioner Piwowar should have a look at this academic paper presented by four professors at New York University entitled: Market Failures and Regulatory Failures: Lessons from Past and Present Financial Crises.

Abstract

“The paper analyzes the financial crisis of through the lens of market failures and regulatory failures. We present a case that there were four primary failures contributing to the crisis: excessive risk-taking in the financial sector due to mispriced government guarantees; regulatory focus on individual institution risk rather than systemic risk; opacity of positions in financial derivatives that produced externalities from individual firm failures; and runs on the unregulated banking sector that eventually threatened to bring down the entire financial sector. In emphasizing the role of regulatory failures, we provide a description of regulatory evolution in response to the panic of 1907 and the Great Depression, why the regulation put in place then was successful in addressing market failures, but how, over time, especially around the resolutions of Continental Illinois, Savings and Loans crisis and Long-Term Capital Management, expectations of too-big-to-fail status got anchored. We propose specific reforms to address the four market and regulatory failures we identify, and we conclude with some lessons for emerging markets.”

It’s really hard to believe that here we are in 2016 having suffered through the Great Recession of 2008 and comments like this continue to be made by regulators. Academic studies in the past have not protected us from market calamities nor will they save us from similar events in the future. We can fight it out with study after study, but I believe that we should never underestimate the ability of market participants who have no “skin in the game” to tank the global financial system.

are-you-kidding-me.jpg

Another recent paper by the Cato Institute looks at Math Gone Mad: Regulatory Risk Modeling by the Federal Reserve. It was written by Kevin Dowd City University London – Sir John Cass Business School.

The paper looks at the the threat of faulty financial modeling and its contribution to recent financial crisis. One of the paper’s conclusions is:

“The Fed’s obsession with math modeling is creating a huge and growing risk for the  U.S. financial system. Yet even though regulatory risk modeling was a key factor behind the weakening of the banking system that broughton the crisis, and even though regulatory stress testing has produced disaster after disaster in recent years, the Fed asks us to believe that it alone, out of all the regulatory stress testers,will be the one to get it right—and this despite the Fed’s own disastrous forecasting record,not least its total failure to anticipate the 2007—2009 financial crisis. The reality is that regulatory risk modeling doesn’t work in the long run. It didn’t work with Fannie and Freddie, it didn’t work in Iceland, it didn’t work in Ireland, it didn’t work in Cyprus, and it didn’t work across much of the rest of Europe, either. There is no reason to think that the Fed’s risk model will be any exception. A betting man would therefore describe the odds of the Federal Reserve leading the banking system into another disaster as a racing certainty. When the postmortem is over, the main damage will turn out to have been done by some risk that the Fed’s stress tests completely missed or, at best, greatly underestimated.

OMG_smaller

That’s the way these things always are. But what clinches it for me is the fact that the Fed is so supremely confident that its stress tests will protect the banking system.

The best insights into the future come not from math modeling but from ancient Greek literature, which reiterates again and again the fates of those who were foolish enough to defy the gods. A case in point is an experienced sea captain who once said:

When anyone asks me how I can best describe my experiences in nearly 40 years at sea I merely say uneventful. Of course, there have been Winter gales and storms and fog and the like, but in all my experience I have never been in any accident of any sort worth speaking about. I have seen but one vessel in distress. . . I never saw a wreck and have never been wrecked, nor was I ever in any predicament that threatened to end in disaster of any sort. . . . I will go a bit further. I will say that I cannot imagine any condition which could cause a ship to founder. I cannot conceive of any vital disaster happening to this vessel. Modern shipbuilding has gone beyond that.

titanic

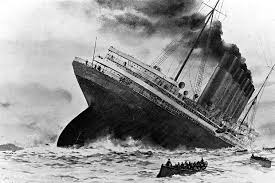
These were the immortal words of E. J. Smith, the captain of the Titanic. However, one has to admit that the Titanic comparison is perhaps a little unfair—at least to Captain Smith. After all, he hadn’t ever encountered a crisis, and he did have good reason to be confident in his ship, whereas we have every good reason to believe that the Fed’s risk regulatory modeling agenda will end up underwater. So when the Federal Reserve Titanic eventually hits its iceberg, we can only hope that its captain will take a leaf out of Captain Smith’s book and have the decency to go down with her ship.”

The important point raised here is that what usually creates financial system chaos is some unforeseen risk, which is what happened in 2008 when all the stress testing and modeling was overwhelmed by a series of events not contemplated. Does this fact not show up on Commissioner’s Piwowar radar screen?

If Commissioner Piwowar ever worked on a trading floor he would see that traders have an incentive compensation package that might best be characterized by heads I win tails you lose. If I perform I have the potential of a huge bonus. If I earn that bonus and tank the place the next year, I don’t pay the money back. Talk about a moral hazard!

So it might make sense if regulators around the world would roll up their sleeves and spend one week on a trading floor as a junior. It would both be a humbling and an informative experience for all concerned.

#equity-swaps, #etfs, #piwowar, #systemic-risk

More on Robo-Advisors Portfolio Selections

Portfolios

A number of the advisors disclose the ETFs that they will be using in their portfolios:

  1. Advisor A-XIC, VUS, VEE, VEF, VSB, VRE
  2. Advisor B-VEU, XSP, XIC, XSB, XBB, XRB, VNQ
  3. Advisor 3-XUS, ZWA, HXT, ZHY, ZRE, VSB, VSC, XEF
  4. Advisor 4-PDF, LEFA, LEME, XIC, ZCS, PHR, VIF, ZHY, ZFM

As you can see, there is some overlap-XIC,VSB,ZHY. They all use Vanguard, iShares and BMO ETFS. there are one or two managed by Horizon.

And they are-

XIC-iShares S&P TSX Capped Composite Index Fund

XSP-iShares Core S&P 500 Index ETF (CAD- Hedged)

XSB-iShares Canadian Short Term Bond Index ETF

XBB-iShares Canadian Universe Bond Index ETF

XRB-iShares Canadian Real Return Bond Index ETF

XEF-iShares Core MSCI EAFE IMI Index ETF

XUS-iShares Core S&P 500 Index ETF

VUS-U.S. Total Market Index ETF (CAD-hedged)

VEE-FTSE Emerging Markets All Cap Index ETF

VEF-FTSE Developed All Cap ex U.S. Index ETF (CAD-hedged)

VEU-Vanguard FTSE All-World ex-US ETF ( a Vanguard US product)

VSB-Canadian Short-Term Bond Index ETF

VSC-Canadian Short-Term Corporate Bond Index ETF

ZRE-FTSE Canadian Capped REIT Index ETF

ZHY-BMO High Yield US Corporate Bond Hedged to CAD Index ETF

ZRE-BMO Equal Weight REITs Index ETF

ZFM-BMO Mid Federal Bond Index ETF

VRE-FTSE Canadian Capped REIT Index ETF

VNQ– Vanguard REIT ETF (US ETF)

Please note that I have provided links to “fact sheets” provide by each of the ETF managers. This will give the reader some additional information on what each ETF is invested in. You must do your own “due diligence” to satisfy yourself that each ETF has objectives and goals that are consistent with your own investment goals. You should carefully check the Management Expense Ratios (“MER”) for each ETF. ETFs with low MERs should predominate given that the premise behind using a robo-advisor is low cost. There are a few ETFs used by the promoters of their robo-advisor.

You can easily see the different asset classes in this list ranging from stocks, bond and real estate. In addition, emerging markets are present as well. There are a couple Vanguard US ETFs included. I assume that the investment advisors thought that these ETFs would be more suitable than the Canadian counterparts. This will introduce a tax element in that payments made to non-residents of the United States will be subject to non-resident withholding tax. Presumably investors will get the tax advice that they need to deal with this aspect of their US investment.

etfs

One should also take note that a number of the ETFs offered are hedged back into Canadian dollars. The idea here is to eliminate the foreign exchange risk in the share investments. It’s questionable whether that is a good approach. One of the reasons that many investors buy shares denominated in a foreign currency is because they want the foreign exchange exposure. Foreign exchange exposure is, however, a two-edged sword as you can see in the case of the Canadian dollar.

The cost of the hedged ETF can be see by comparing the performance of two ETFs. XUS and XSP, XUS is quoted in Canadian dollars but the underlying is in US dollars. For one year XSP returned -1.0% while XUS has returned 18.0%. This is the result of hedging back into Canadian dollars. The entire gain has been eliminated through the hedge. Needless to say, this will swing around if and when the Canadian dollar strengthens.

Here is an old but interesting article on the topic. There’s no date on it but it must have been written quite a while ago as the author discusses the elimination of the foreign securities cap on RRSP investments. No need to hedge against the loonie.  In my opinion, the point is that hedging the dollar defeats the purpose of holding US dollar denominated stocks. It’s like buying a real estate ETF and hedging the price of real estate. It’s an inherent element of what we are trying to accomplish-diversification aways from Canada.

MA_blog_img_canadian_dividends_03

The last twenty four months have been pretty ugly for the Canadian dollar. But for those invested in the United States, it’s been a great ride. In the last year the Canadian dollar has dropped around 16%.  As to when and if this swings around is anyone’s guess. But each investor needs to make a decision as to whether or not they want to participate in this for the good and the bad. It’s a tough decision which cannot be taken lightly.

Risk-Profit-and-Loss-1


#bmo-etfs, #etfs, #foreign-exchange-exposure, #ishares-etfs, #robo-advisors-2, #vanguard-etfs

More on Canadian Robo-Advsiors

Robo-Advisors

There are already a number of robo-advisers operating in Canada. It seems to be getting fairly crowded already. What I am going to do here is summarize what’s out there by reference to an article in the Globe & Mail: “The Globe and Mail Guide to Online Advisers“. As you will see, it’s a bit hard to distinguish between them which I think will inevitably cause a bit of a marketing problem. They offer a commodity product. I am not sure how potential clients will choose between them:

  1. Invisor
  2. Modern Advisor
  3. NestWealth
  4. Portfolio IQ
  5. Robo Advisors Plus
  6. Smart Money
  7. Wealthbar
  8. Wealthsimple

These are the ones that I am so far able to find. There may be others. If you look  at the Globe & Mail spreadsheet it is difficult to differentiate one of these offerings from another. They all invest in ETFs. They all have similar fees and similar sponsorship.

Commodity Products

What is a commoditized product?

DEFINITION of ‘Commoditize’

The act of making a process, good or service easy to obtain by making it as uniform, plentiful and affordable as possible. Something becomes commoditized when one offering is nearly indistinguishable from another. As a result of technological innovation, broad-based education and frequent iteration, goods and services become commoditized and, therefore, widely accessible.

So robo-advisors fit pretty squarely into this definition. Those singing the praises of robo-advisors must understand that they are not competing with traditional investment advisors. I see many writings on the Internet implying that the robo-advisors will steal market share from traditional advisors. I don’t believe they will. I believe that they will service a segment of the investment market that traditional investment advisors don’t want. The low dollar, low volume accounts that they have traditionally been unable to service.

So in looking at whether or not a robo-advisor is suitable for you, consider the product offering. Very little customization is possible because of the low-cost structure. If you have some ETFs that you would like to include, most if not all won’t offer that service.

mistakes-are-proof-that-you-are-trying

Alternatives

If you check out the BMO ETF website and the Vanguard ETF website you can construct an ETF portfolio with the model there. The Vanguard model builder is,in my opinion, a bit more robust. Many will likely find that with a little bit of ETF education, you may be able to manage your own ETF portfolio. You have the maximum control when you DIY it. But different people will have different preferences.

#etfs, #investment-management, #investment-philosophy, #robo-advisors-2

ETF Performance

Some Historical Results

I did some basic backtesting on the ETFs in  one of the robo-advisors portfolios disclosed on their website.  I wanted to see how the ETFs performed. The time period covered  is from April 26, 2013 to December 31, 2015. Google Finance seems to have locked me into these dates.  If you click the five-year tab you get these dates. This of course assumes that the ETFs were held throughout the period without adjustment. My analysis here is for information purposes.

As you can see, the results are interesting:

XUS +78.0%

ZWA+7.5%

HXT+19.6%

ZHY-16.7%

ZRE-16.8%

VSC-2.0%

XEF+39.9%

It’s the weightings (asset allocation) that ultimately drives the return on this one. The XUS and XEF are the real winners here (dividend reinvestment is not included here). But remember when you look at this that the returns are partially the result of the ETFs being quoted in Canadian dollars. Some of the uplift may have resulted from the decline of the Canadian dollar. One needs to bear this in mind when looking at the long-term returns that one can hope to achieve. The other winner was XEF. These two ETF’s accounted for 32.5% of the portfolio using the weightings suggested by the robo-advisor.

The weighted average will give us the return for the period. XUS-20%; ZWA-5%; HXT-20%; ZHY-12.5%; ZRE-20%; VSC 10%; XEF-12.5%. The calculated weighted average return is a respectable 19% approximately. But let’s drill down a bit.

Some considerable portion of this would have been attributable, as I mentioned above, to the change in the CAD/US exchange rate. The Canadian dollar was down some 30% during that time period.

The Canadian market investments provided a dismal return, but that not something the portfolio managers can control. Once they make their asset allocation decisions they (and the investor) are in for the ride.

But the fact is that the portfolio generated almost a return of approximately 19% (estimated). It’s likely that the asset allocation would have been rebalanced as the positions in XUS and XEF would have exceeded its original allocation by a wide margin. That would have changed the outcome during the period under examination. It’s difficult to know how much rebalancing might have been done throughout the period under review.

what next

Interim Conclusion

What has been developed here is a new spin on a fund of funds. A new fund is created (not a formal one) that is populated by ETFs. The use of ETFs has driven down the cost to the investor and the technology drives down the operational costs. You’ll see that the management teams of the robo-advisors are populated with engineers and software developers, as well as investment professionals. So arguably there is a lot of “firepower” here.

I would need to satisfy myself that the asset allocations determined by their model are suitable for me and meet my overall investment objectives.

#etfs, #robo-advisors-2, #wealthbar

The Portfolio Choices

How  To Build My Portfolio

So trying to keep things moving along, I now how to look at how I am going to put together my portfolio. I have firstly decided to do it myself. Not because I am any better at it but because it’s my money and I don’t think anyone will be as interested in managing it as I will be. And I have the time and interest to do it.

What to Include in My Portfolio

Well here I go. In looking at the model it contemplates a portion of cash, fixed income and equities. The cash/fixed income portion is needed to fund or finance some proportion of my retirement. It’s secondary and perhaps equally important role is to act as a buffer in the event of a significant stock market declines which interrupts the buildup of value in the equity portion of the portfolio. But how much of the portfolio should be included here? What percentage?

At the present time I am holding my portfolio in fixed income ETFs. The problem that I see with them is the rather long duration of the ETFs and the corresponding interest rate risk. It sort of defeats the purpose of holding the cash reserve fund if that has risk attached to it that is equal to my equity risk. Although I am loath to shorten up the duration because of the loss of return, I feel compelled to do so if I am going to seriously try to deploy the portfolio model that I am selecting.

The Short Term

There are many ETFs available to help me achieve this goal. The nice part of the ETFs is that the interest (as small as it is) will be re-invested. At least I can ring-fence the re-investment risk as small as it is.

The alternative would be to buy individual bonds but my discount brokers commission structure is such that it would make it very difficult to keep the cost down. I would need to select my maturities to mirror the withdrawal of funds, which would mean that I would need bonds to mature every two months. The other choice here would be to use a bank deposit alternative in Canada that the banks offer. It would be easier to stagger maturities that way, but the returns at the short end of the interest rate curve are close to cash, namely, zero. Here are some GIC rates from the Royal Bank of Canada.

Interest Paid at Maturity

Term
to
Maturity
For Investments of
$5,000
to
$99,999.99
$100,000
to
$249,999.99
$250,000
to
$999,999.99
$1,000,000
to
$4,999,999.99+
[%] [%] [%] [%]
1 to 29 days n/a(1) 0.050 0.050 0.050
30 to 59 days 0.100 0.200 0.200 0.200
60 to 89 days 0.250 0.350 0.350 0.350
90 to 179 days 0.350 0.450 0.450 0.450
180 to 269 days 0.450 0.450 0.450 0.450
270 to 364 days 0.400 0.500 0.500 0.500

Here are current GIC rates offered by the Royal Bank of Canada as of December 4th, 2015. As you can see, nothing is offered for 1 to 29 days and the 30 to 59 day rate is 0.100%. On a $10,000 deposit for 60 days the returns are negligible. Small wonder that the banks have been reporting such high profits in an interest rate environment where they pay virtually nothing. The deposit insurance premiums are likely higher than the interest cost.

Because of these insignificant yields I will be looking at fixed income ETFs. The universe of ETFs that I will be looking at include Vanguard, BMO, and iShares.
BMO Ultra Short-Term Bond ETF
ETF Profile
Ticker Symbol ZST
Net Assets ($MM) (Dec 04, 2015) $51.7
Market Price $54.4600
12 Month Low/High (Market Price) $54.44 / $56.40
Price (NAV) (Dec 04, 2015) $54.4594
12 Month Low/High (Price (NAV)) $54.44 / $56.42
Weighted Average Term (yrs) 0.61
Weighted Average Coupon (%) 3.86%
Annualized Distribution Yield (Nov 30, 2015) 1 3.97%
Weighted Average Yield to maturity (%)2 1.36%
Weighted Average Duration (yrs) 0.58
Maximum Annual Management Fee 0.150%
Eligibility RRSP/RRIF/RESP/DPSP/ TFSA
Date Started Jan 28, 2011
Fiscal Year End December 31
Units Outstanding (000’s) 950
CUSIP 05579A107
Index
Exchange TSX
Related Links / Downloads

BMO Ultra Short-Term Bond ETF
Legal & Regulatory Documents

Portfolio Strategy
BMO Ultra Short-Term Bond ETF has been designed to provide exposure to a diversified mix of short-term fixed income asset classes with a term to maturity of less than one year or reset dates within one year. The Fund invests primarily in government bonds and investment grade corporate bonds, but also has exposure to high yield bonds, floating rate notes, and preferred shares. The portfolio is rebalanced based on the portfolio manager’s fundamental analysis, relative strength indicators, and risk adjusted yield expectations.
 1 Annualized Distribution Yield: The most recent regular distribution (excluding year-end distributions for those ETFs that distribute more frequently) annualized for frequency divided by current NAV.
 2 Weighted Average Yield to Maturity: The market value weighted average yield to maturity includes the coupon payments and any capital gain or loss that the investor will realize by holding the bonds to maturity.

Here is a BMO ETF that I might consider. The return is calculated on December 4th, 2015. The MER is low and at least it leaves me some income on an annualized basis. This is not a recommendation of any sort, simply an example of what’s out there. So for the first six months of my “cash” reserve I might use an investment vehicle like this. Having said that, the returns are negligible.

What’s next? Look for something to cover off the next three years plus. I am trying to minimize the risk as much as possible, maintain some semblance of an investment return and match off duration with the timing of my cash needs. The time periods are arbitrary.

The Medium Term

BMO Short Corporate Bond Index ETF
ETF Profile
Ticker Symbol ZCS
Net Assets ($MM) (Dec 04, 2015) $904.8
Market Price $14.5700
12 Month Low/High (Market Price) $14.54 / $15.00
Price (NAV) (Dec 04, 2015) $14.5723
12 Month Low/High (Price (NAV)) $14.56 / $15.00
Weighted Average Term (yrs) 2.98
Weighted Average Coupon (%) 3.65%
Annualized Distribution Yield (Nov 30, 2015) 1 3.54%
Weighted Average Yield to maturity (%)2 1.97%
Weighted Average Duration (yrs) 2.78
Maximum Annual Management Fee 0.120%
Eligibility RRSP/RRIF/RESP/DPSP/ TFSA
Date Started Oct 20, 2009
Fiscal Year End December 31
Units Outstanding (000’s) 62,093
CUSIP 055976104
Index FTSE TMX Canada Short Term Corporate Bond Index
Exchange TSX
Related Links / Downloads

Legal & Regulatory Documents

Portfolio Strategy
BMO Short Corporate Bond Index ETF has been designed to replicate, to the extent possible, the performance of the FTSE TMX Canada Short Term Corporate Bond IndexTM, net of expenses. BMO Short Corporate Bond ETF invests in a variety of debt securities primarily with a term to maturity between one and five years. Securities held in the Index are generally corporate bonds issued domestically in Canada in Canadian dollars, with an investment grade rating.

Benchmark Info
The FTSE TMX Canada Short Term Corporate Bond IndexTMconsists of semi-annual pay fixed rate corporate bonds denominated in Canadian dollars, with an effective term to maturity less than five years but greater than one year, a credit rating of BBB or higher and minimum size requirement of $100 million per issue. The corporate sector is divided into sub-sectors based on major industry groups: Financial, Communication, Industrial, Energy, Infrastructure, Real Estate and Securitization. Each security in the index is weighted by its relative market capitalization and rebalanced on a daily basis.

 1 Annualized Distribution Yield: The most recent regular distribution (excluding year-end distributions for those ETFs that distribute more frequently) annualized for frequency divided by current NAV.
 2 Weighted Average Yield to Maturity: The market value weighted average yield to maturity includes the coupon payments and any capital gain or loss that the investor will realize by holding the bonds to maturity.

An alternative to the two ETFs presented above are offerings by Vanguard-VSB and VSC.  Normally the differences in yield are attributable to differences in the underlying portfolio investments. More particularly, credit rating. So I need to examine the portfolio mix to see whether I am comfortable with the underlying investments credit quality. This will take some time but given that I need this liquidity I will err on the side of caution. The return differential between these ETFs and my overall return requirements will then be added onto the return that I need to earn on the equity side of the portfolio. I would prefer to avoid ETFs with a longer duration than this as the potential for material loss on short-term funds starts to increase. Unfortunately in the Canadian universe of bond ETFs my choices are limited.

So I will be looking to cover off the time frame that my cash/fixed income investments need to be available to me. Implicitly that means that I need to pick a term. I have going to go with four years as the term I need to cover off. So when I look at equity investments, I need to somehow figure out recovery time between market meltdowns and back to “normal”. I wonder if this information is out there.

More to come.

#bucket-portfolio, #etfs, #gics, #investment-philosophy, #portfolio, #returns, #short-term-investments